Is my coin outperforming its index?
Choose a DPMI index and a coin from its current basket. A shared starting value of 100 makes their performance directly comparable.
Coin versus index →Dudelytics / Your analysis lab
Welcome to your crypto control room.
Compare coins and indices. Look beneath price movements. Discover for yourself what the numbers reveal.
Members’ area · English & German · use your existing account
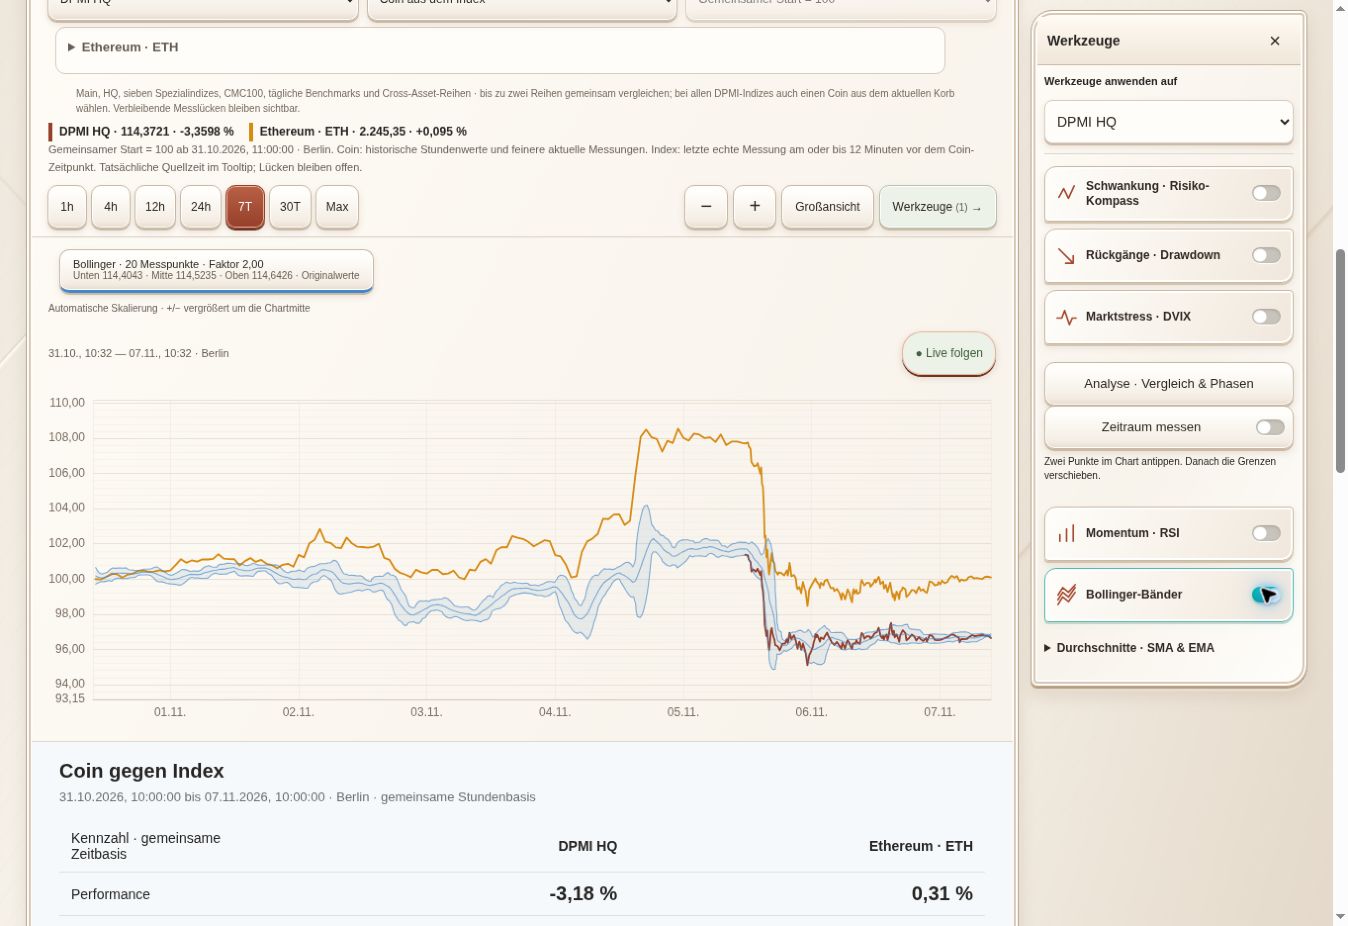
Actual Lab view captured on 7 November 2026: Ethereum versus DPMI HQ with Bollinger Bands. Example screenshot, not live data. Screenshots show the German interface; the Lab is also available in English.
Explore / Compare / Understand
Choose a DPMI index and a coin from its current basket. A shared starting value of 100 makes their performance directly comparable.
Coin versus index →Switch on Drawdown. See the decline from the reference high, time spent below it and whether a recovery was actually observed.
Understand drawdowns →Add DVIX and explore stress phases. Compare how indices behaved over the same period.
Explore market stress →

DPMI Main, HQ and seven sector indices. Plus coins, CMC100 and available benchmark and cross-asset series.
Volatility, relative strength and correlation help you explore differences and shared movements.
Drawdown, underwater time and observed recovery make declining periods easier to examine.
SMA, EMA, Bollinger Bands and RSI. Choose which series the tools apply to.
Measure a period, pan through time and zoom around the centre. Automatic updates preserve your historical view.
DVIX market stress, DPMI Fear & Greed and the analysis cockpit add further perspectives to your comparisons.
No. Start with an index and a time window. Explanations beside the tools show what the figures mean and where their limitations lie.
A usable observation is missing. The Lab does not invent values to connect a line. Availability, intervals and shared comparison periods may differ between series.
No. It examines observed data and does not predict prices. An index is not an investable portfolio, and its behaviour is not a promise about your personal risk.
Select “Open the Lab” and sign in with your active, verified Dudelytics account. This public page shows what to expect before you enter.
Powerful analytics. No PhD required.
Come in, Dude. Touch everything. The data won’t bite.
Open the Lab →